
This month’s Reeport update includes the launch of the viewer mode, dynamic filters, smart widgets, a new data connector, and more!
Data Sharing and exploration
-
Viewer mode
-
Dynamic filters
Data visualization
-
Sunbursts
-
Table Template
Query
-
Smart Widget
-
Statistical formulas
-
Multi-dimension Widgets
Data Connectors
-
Google Analytics Multi-Channel Funnels
Security & Infrastructure
-
Dedicated servers
Miscellaneous improvements
-
Widgets
-
Broadcast
-
Shortcuts
Data Sharing and Exploration
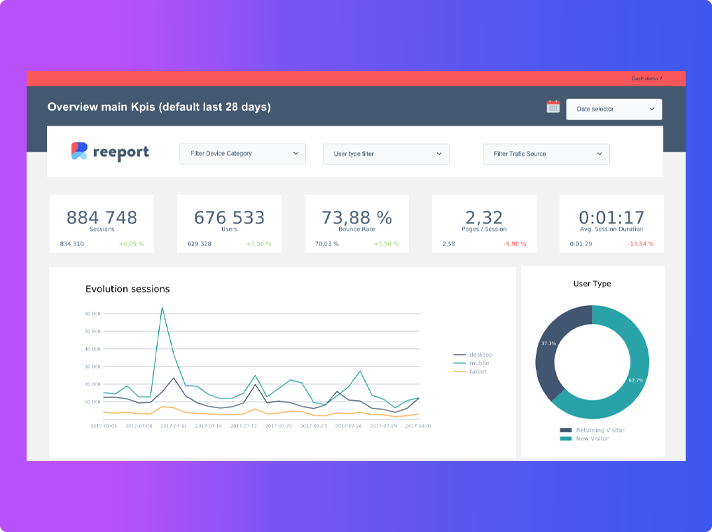
Viewer mode
The Viewer mode allows you to share your dashboards online. Viewers can now navigate across your reports and interact with your dashboards.
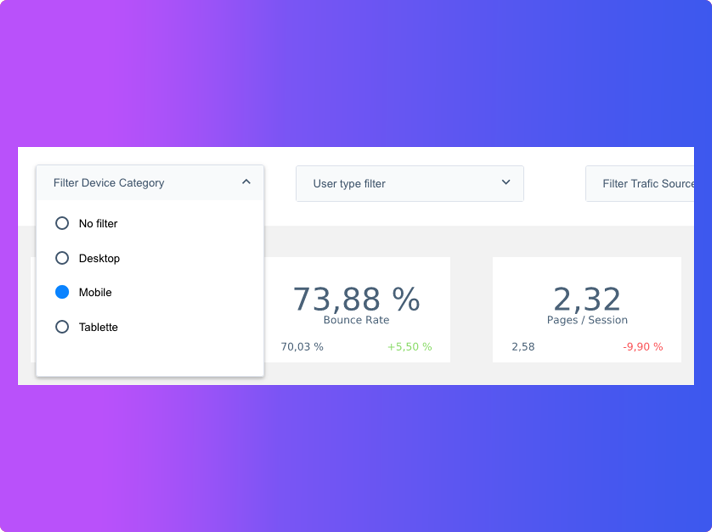
Dynamic filters
Dynamic filters are a great way to empower your Viewers to interact with data. Builders can prepare dynamic dashboards and let Viewers play with data based on pre-set filters (e.g., period of time, user type, device category, etc).
Data visualization
Sunburst
Sunbursts are a great way to visualize multi-dimensional analyses (e.g., day of the week and hour of the day, device type and acquisition channel and landing page, etc).
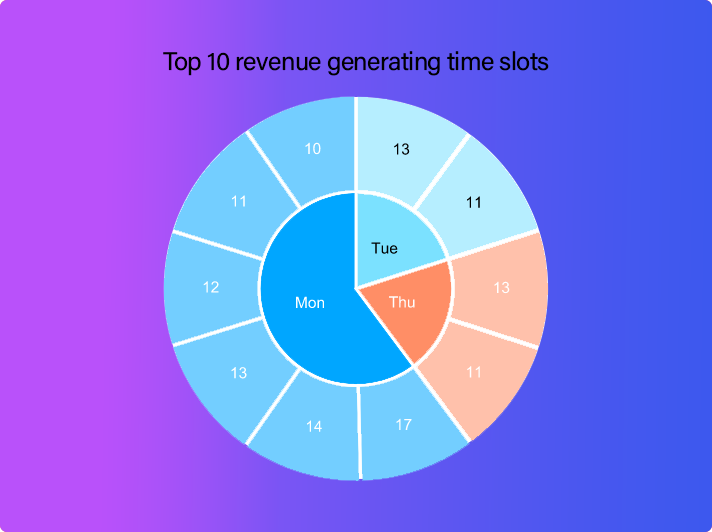
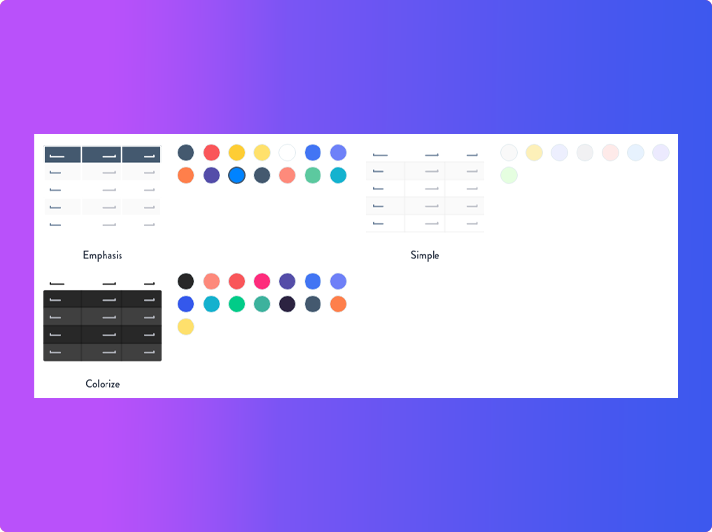
Table templates
You can now customize your Table Widgets with a wide range of themes.
Query
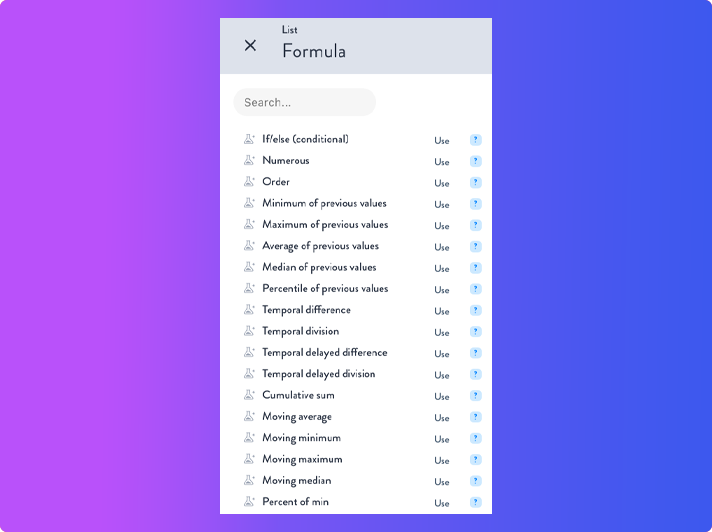
Statistics formulas
Fetching data from one or several data sources is the easy part! In order to go beyond that, we’ve made it possible for you to run calculations on your data using statistics formulas. With these functions at hand, you can now use simple and advanced statistics to take your analysis a step further!
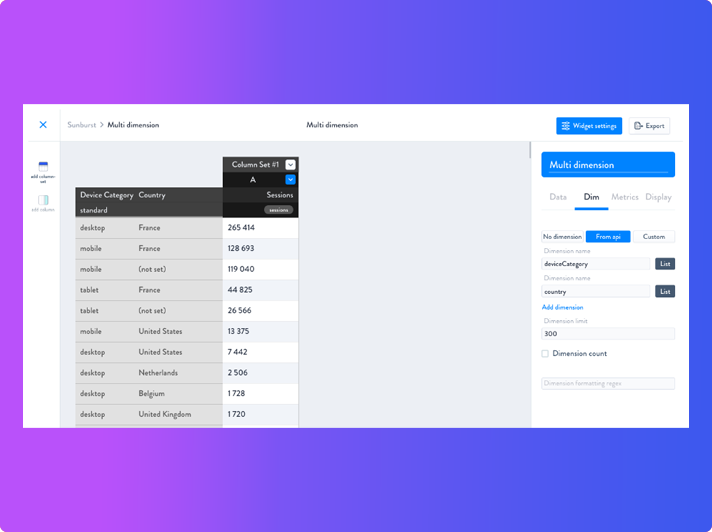
Multiple dimensions
Life would be too easy if one dimension was enough to run a thorough analysis…so we used our free time this summer to give you the ability to run multi-dimensional analyses!
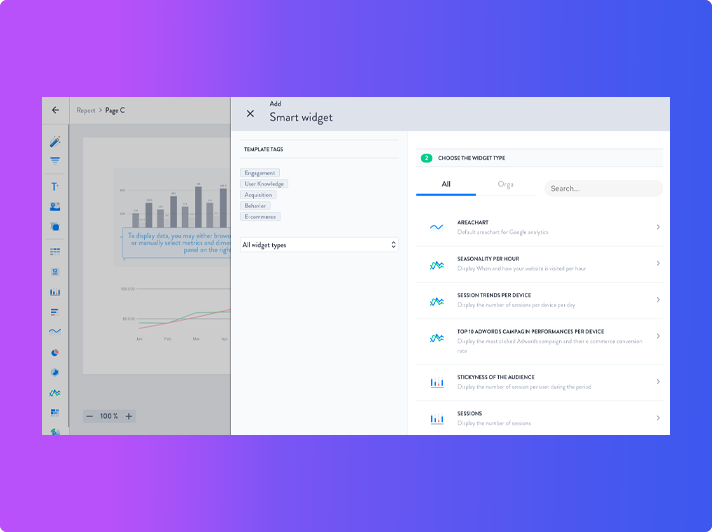
Smart Widget
Starting from a blank slate is not easy – that’s why we’ve built Smart Widgets! This gives you access to a range of pre-configured Wigdets.
Data connectors
Google Analytics Multi-Channel Funnels (MCF)

Security and Infrastructure
Dedicated servers
You now have the possibility, upon request, to get dedicated servers for optimal performances when using Reeport.
Miscellaneous UX improvements
Widgets
-
You can now transform a scorecard Widget (aka Single KPI Widget) into any other type of data Widget.
-
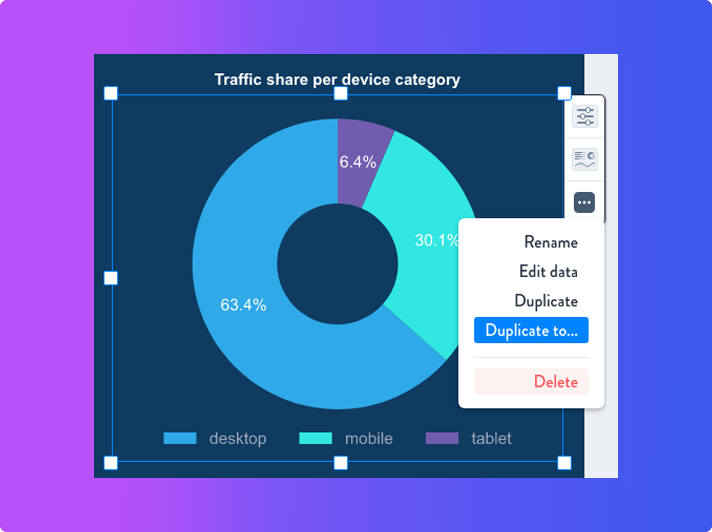
You can also duplicate a Widget from one Page to another within a Report.
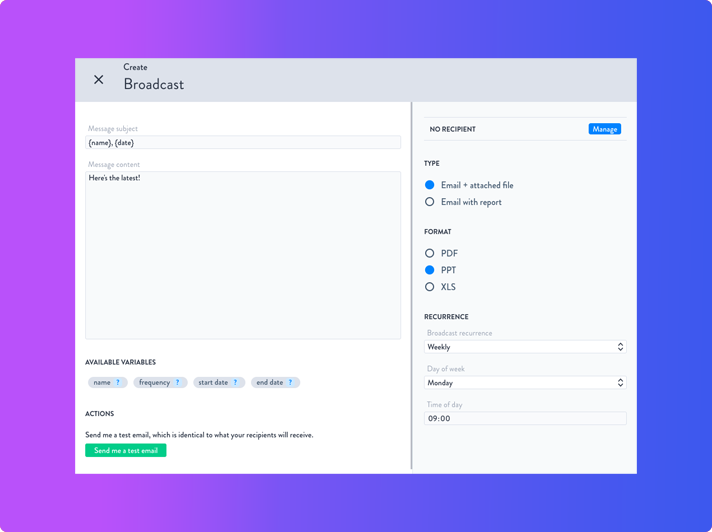
Broadcast
We’ve updated the UX for Report Broadcasts, thus making is easier to set up a scheduled delivery for your Reports.
Shortcuts
-
Use shift + arrow to move Widgets in a Page
-
Use back or del to delete a Widget
-
Use shift or ctrl + click to multi-select Widgets and apply mass edits (add a Condition, change the Date Range or Data Source, etc.)

COMMENTAIRES