
In December, an updated UI, new broadcast formats, and widget background option make the headlines!
Data Sharing and exploration
-
UI update
-
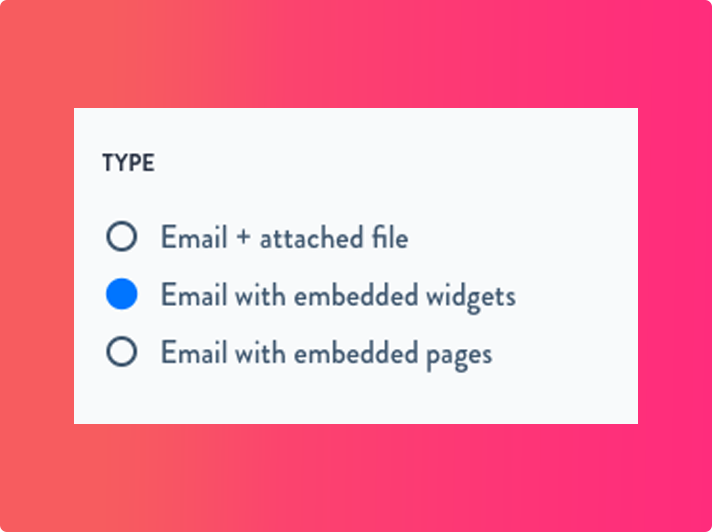
New broadcast formats: email with embedded widgets, email with embedded widgets/pages
Data Visualization
-
Donutchart: option to use metrics instead of dimensions
Security & Infrastructure
-
Improved performances
Miscellaneous improvements
-
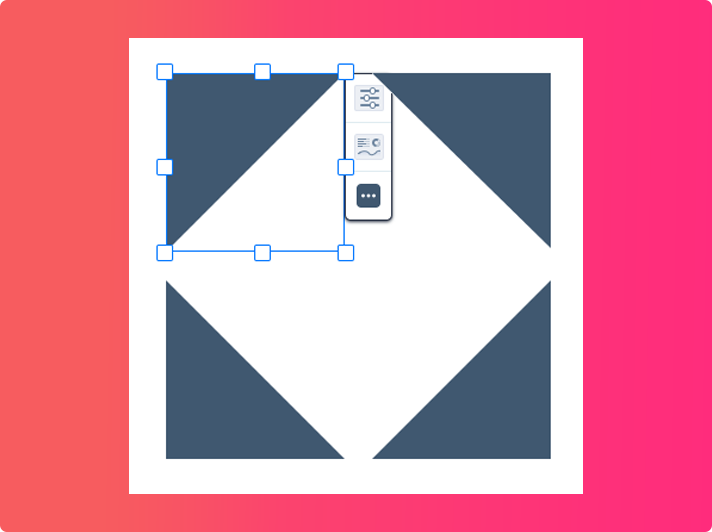
New shape : angle triangle
-
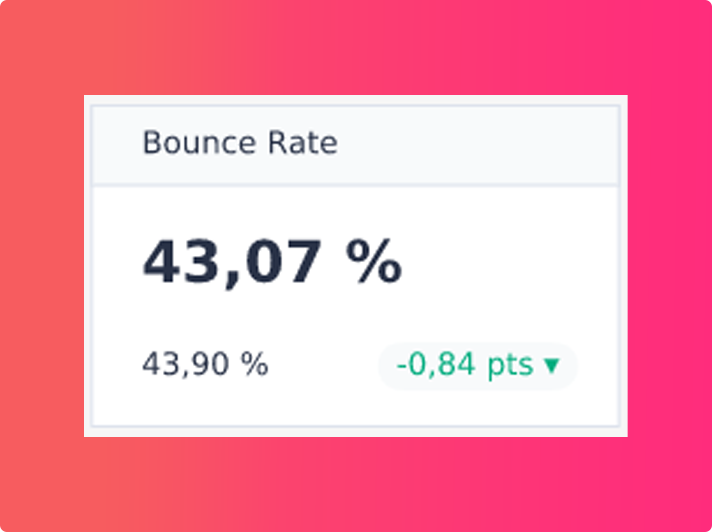
New conditional formatting: percentage points
-
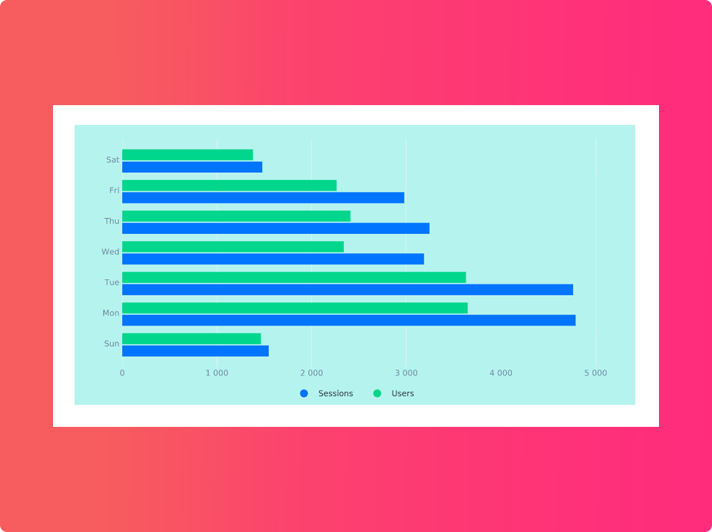
Widget background option
Data Sharing and Exploration
UI update
Reeport just got an updated UI in order to make as smooth as possible!
Before
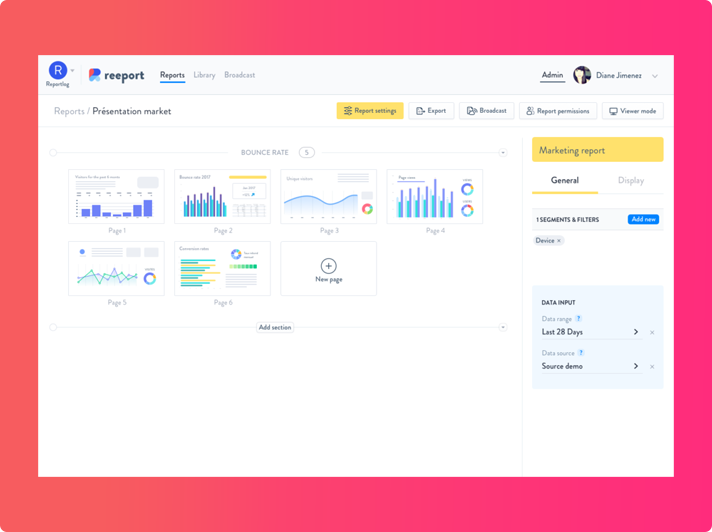
After
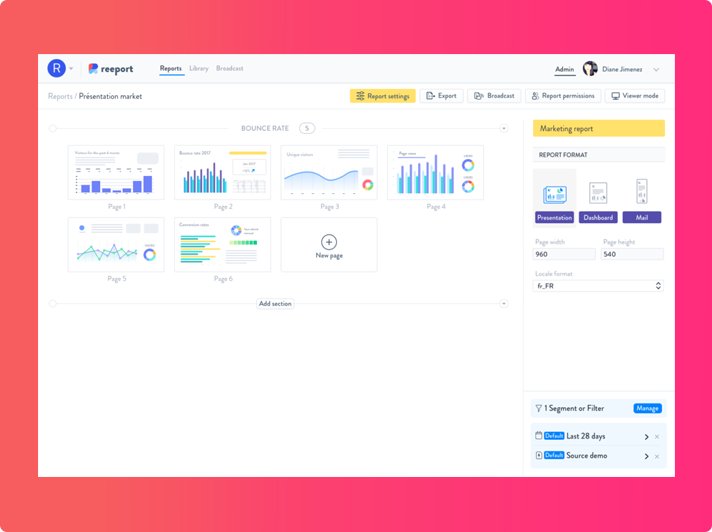
New side-panel
New broadcast formats
You can now include preview of your Pages or Widgets within your broadcast emails.

Data visualization
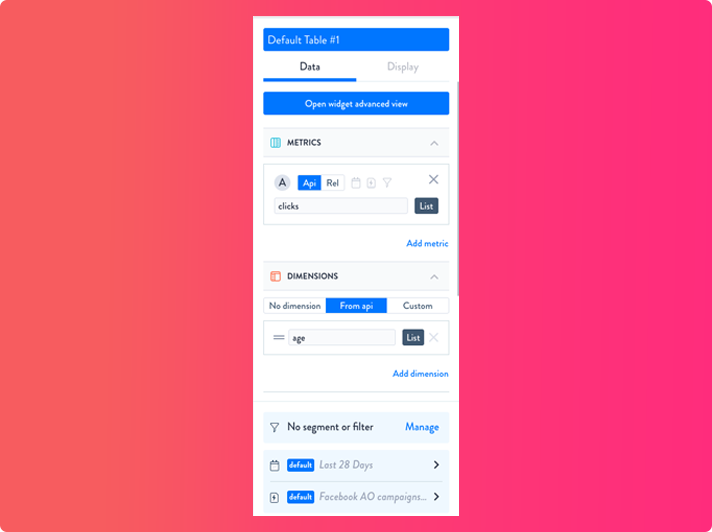
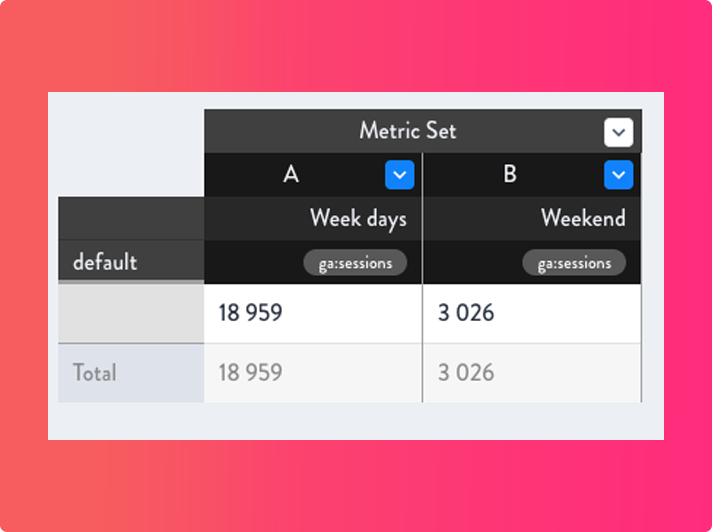
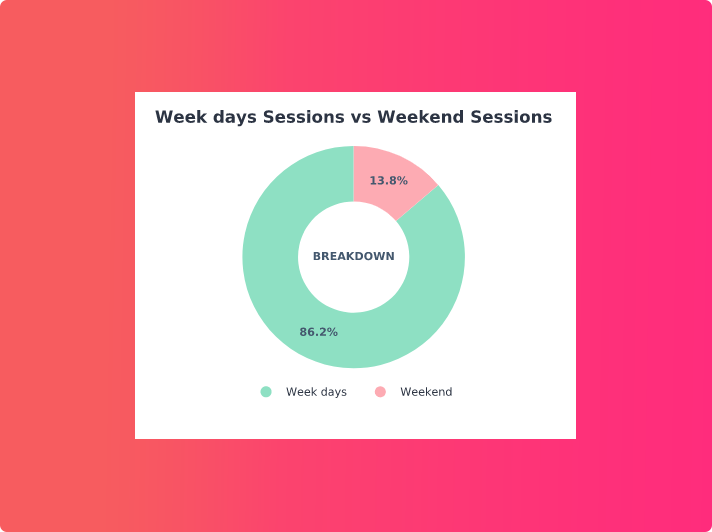
Donutchart: option to use metrics instead of dimensions
It is now possible to pivot the data table used by your donutchart.
Dimension data
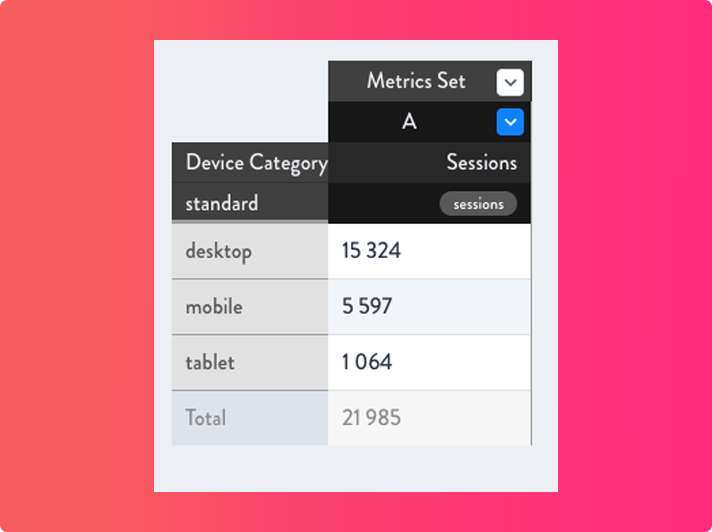
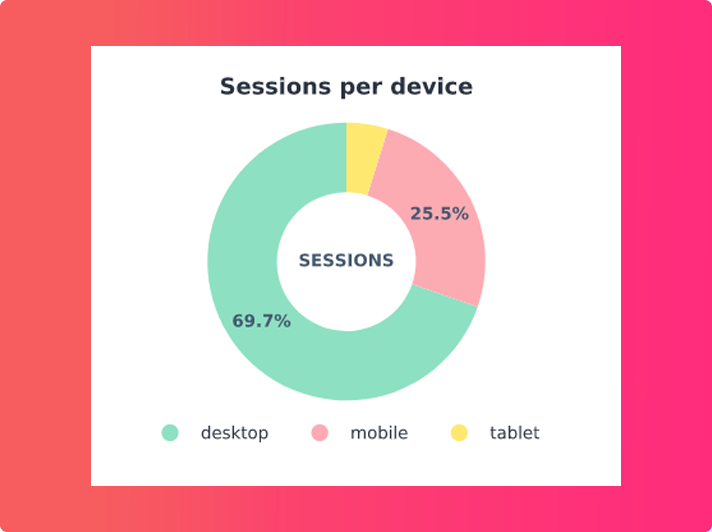
Metrics datas
Security and Infrastructure
Improved performances
Miscellaneous UX improvements
New triangle shapes
New conditional formatting: percentage points
Widget background option
You can now add a background color to your Widgets.


COMMENTAIRES