
In May, the Google Ads connector and optimized dashboard creation for mobile make the headlines!
Data sources
-
New: Google Ads
-
Upgrade: Facebook Ads v3.2
-
Upgrade: Forecast
Data sharing & exploration
-
Optimize your dashboards for mobile
Data visualization
-
Custom "min" and "max" values for Y Axis now available on custom charts
Query
-
Compare date "Same Days Last Year" now available for semi-floating date ranges
-
SalesForce filters now available
Data sources
New connector: Google Ads

Upgraded connector: Facebook Ads updated to v3.2
Upgraded connector: New dimensions for Forecast

Data visualization
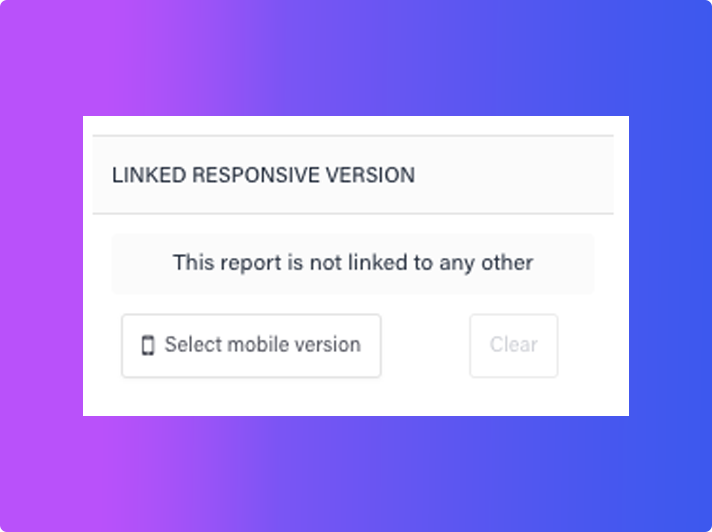
Optimize your dashboards for mobile
You can now create two versions of a dashboard in order to have a desktop-friendly version as well as a mobile-friendly one. Link the two versions and, as a result, viewers will be redirected to the best-suited version.
Data sharing & exploration
Custom "min" and "max" values for Y Axis now available on custom charts
Query
Compare date "Same Days Last Year"now available for semi floating date ranges
Example: If your dashboard's date is set to "Since 2019-01-01" the compare date "Same Date Last Year" will begin from 2018-01-01 and end on the same date as yesterday, last year.
SalesForce filters are now available


COMMENTAIRES