
In January, a brand-new homepage, widget descriptions, and the new table widget make the headlines!
Data sharing & exploration
- New homepage
- Widget descriptions
Data visualization
- New table widget
Miscellaneous
- New knowledge base
- A new way to find answers to your questions!
Data sharing & exploration
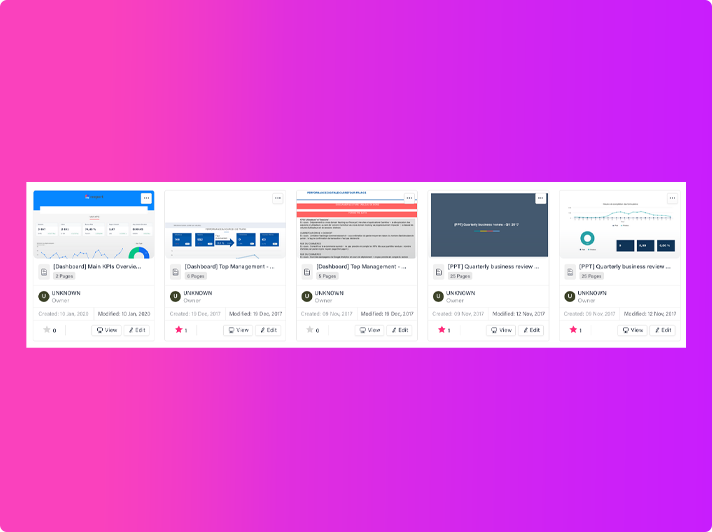
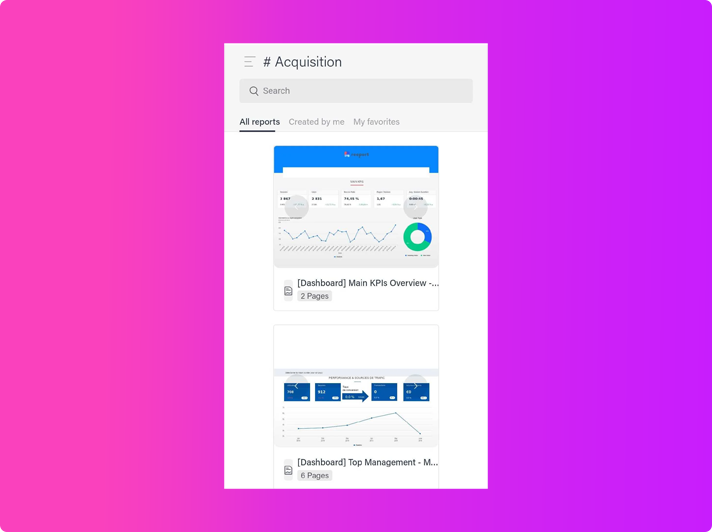
New homepage
The new homepage is now live! New features include:
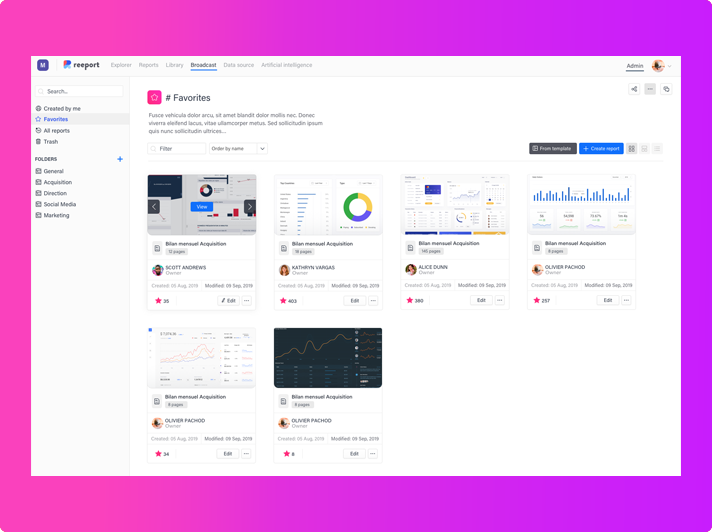
- A clear overview (note that you can switch back to the list view)
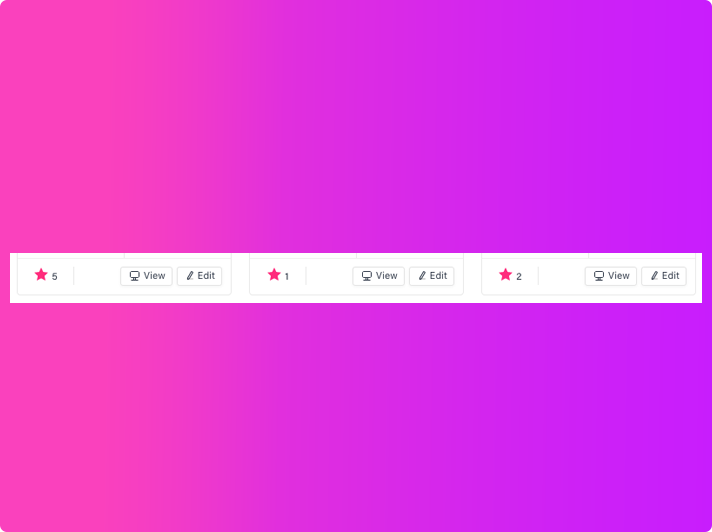
- Add reports to your favorites
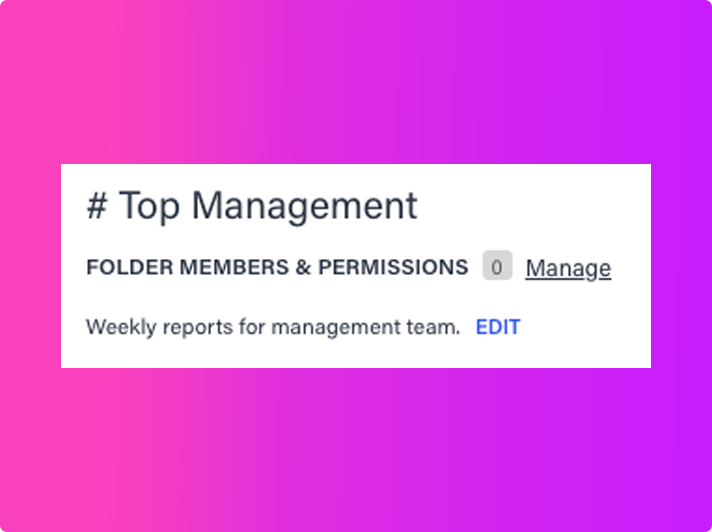
- Add folder descriptions
- Find your reports easily even on mobile
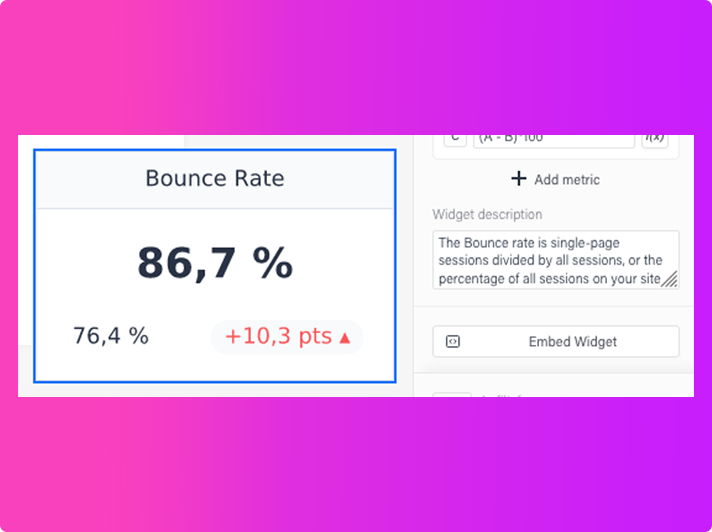
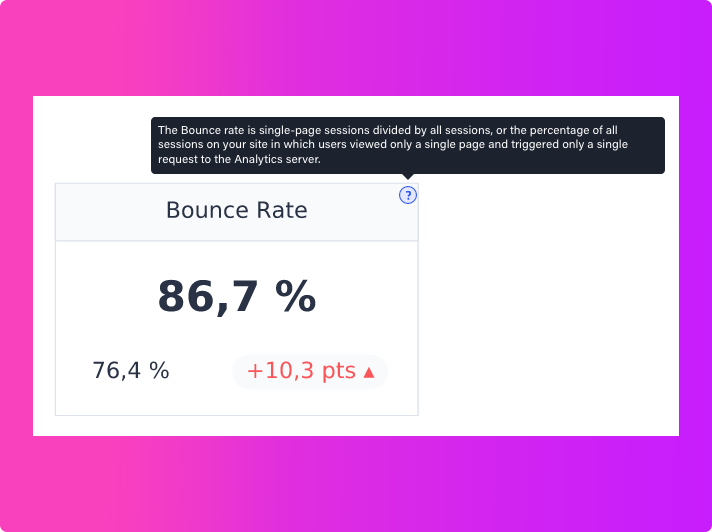
Widget descriptions
You can now add descriptions to your widgets. As an example, builders can now write a KPI definition to help viewers understand what the data means.
Data visualization
New Table Widget
The table widget gets enhanced with new possibilities. For instance you can resize each of your column or even scroll your table! If you have many lines don't hesitate to use the pagination instead!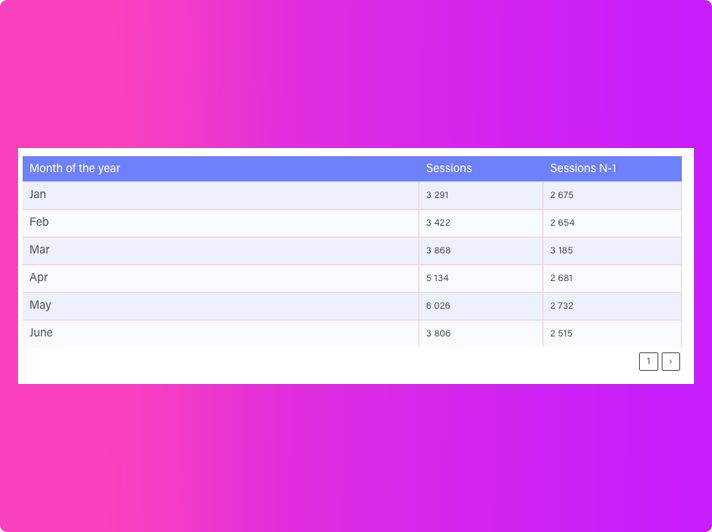
Miscellaneous
New knowledge base
We just launched our new knowledge base. You can now access articles, in English or French, here.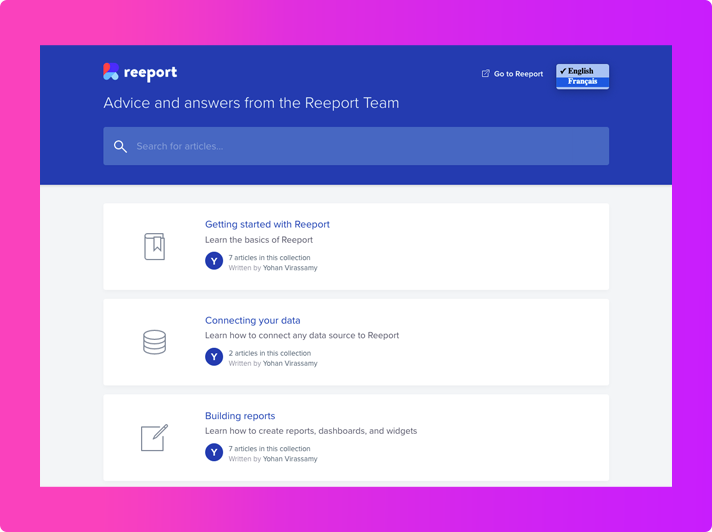
A new way to find answers to your questions!
For any question or feedback you have you can now click on the blue icon located at the bottom right corner. You can also access articles (in English and French) from our knowledge base. This feature is available everywhere on the app except for the viewer mode. We look forward to your feedback and questions!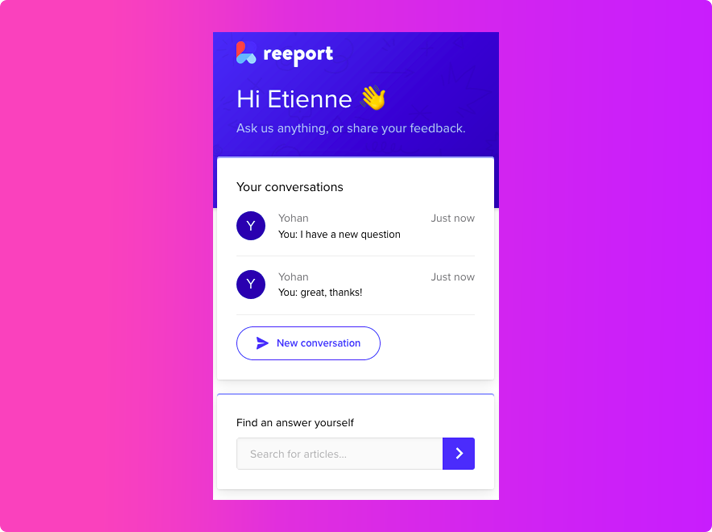


COMMENTAIRES