
Reeport comes back to school with a makeover, new data connectors and many more updates!
Data Connectors
-
Dailymotion
-
Mediametrie Digital Ad Ratings (ex Nielsen OCR)
Overall design
-
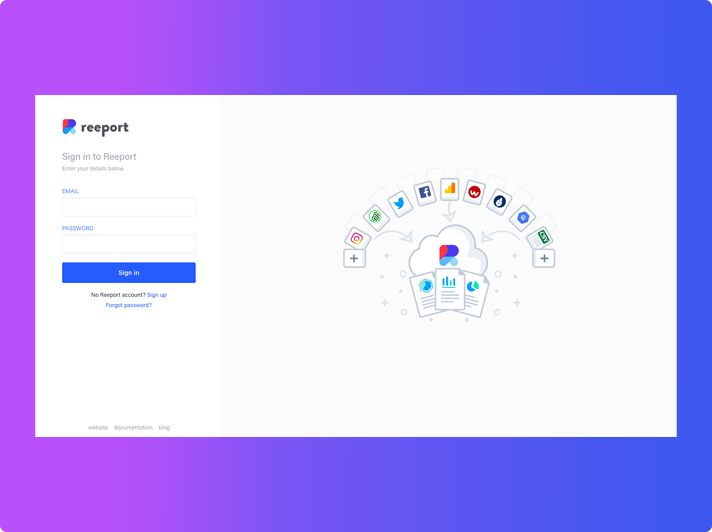
Reeport makeover
Data visualization
-
New data visualization: Gauge chart
-
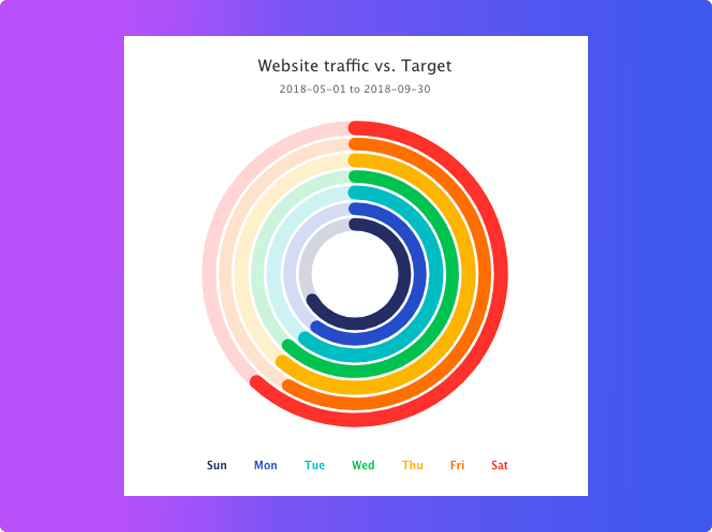
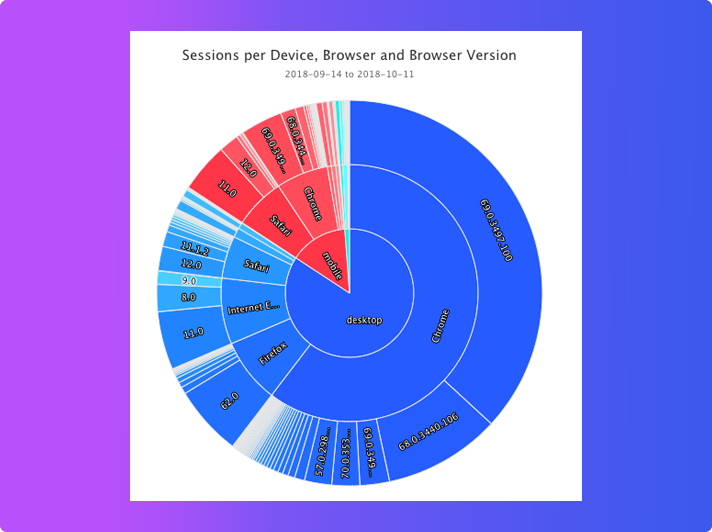
Updated data visualization: the Sunburst chart is now dynamic
-
Cleaner value formatting on your charts
-
Ability to only display minimum and maximum values
Extended account administration features
-
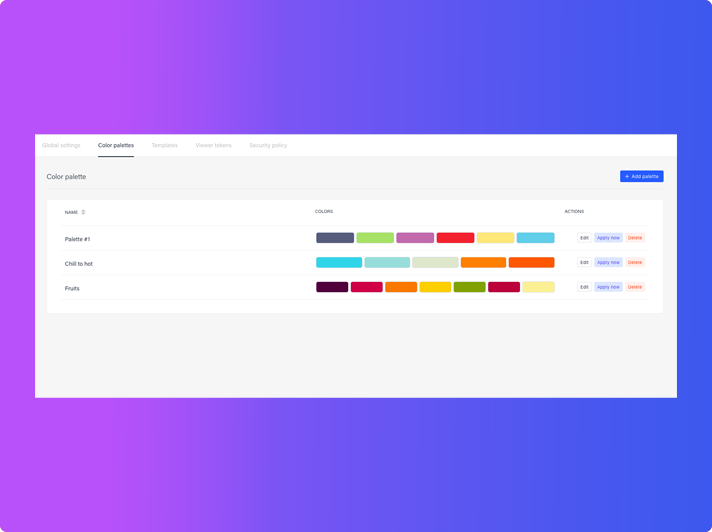
Custom color palettes
-
Report and widget templates
-
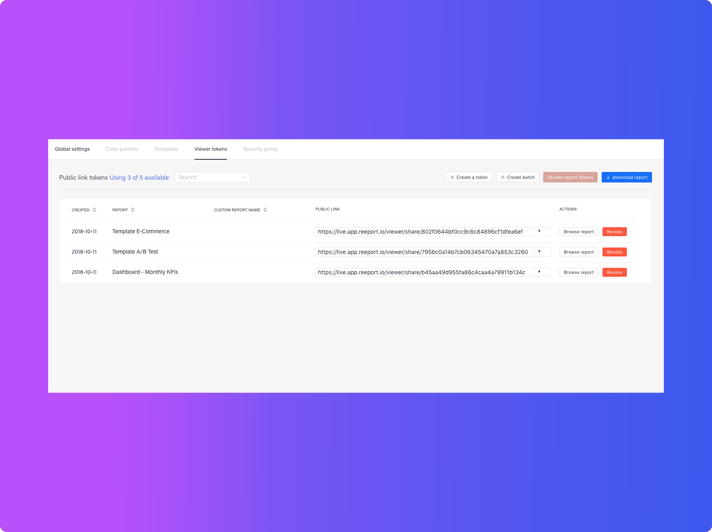
Public url tokens
-
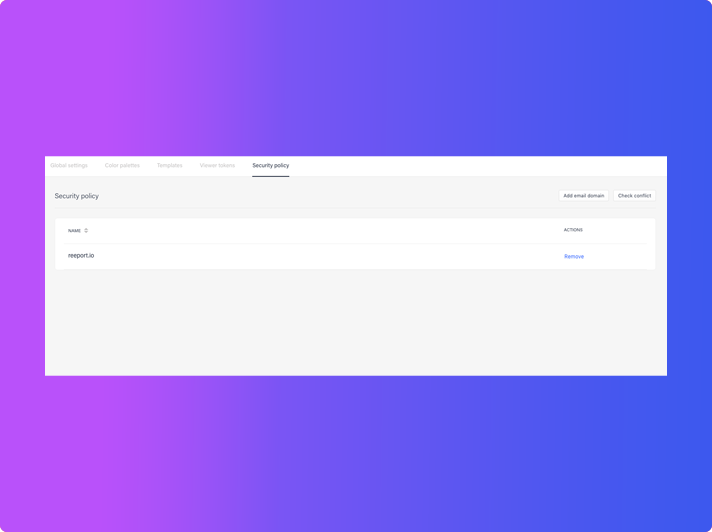
Email domain security policy
Data connectors
Dailymotion
Mediametrie Digital Ad Ratings (ex Nilesen OCR)
Overall design
Reeport makeover
Data visualization
New data visualization: Gauge chart
Updated data visualization: the Sunburst chart is now dynamic
Cleaner value formatting on your charts
You'll now be able to get "20%" instead of "0.2" as well as "2,100,000" (or "2 100 000" depending on your locale format) instead of "2100000" across all your charts.
Ability to only display minimum and maximum values
Extended account administration features
Through the organization options you can access to sub-features to enhance your work and control the access of your data:
Custom color palettes
Create your own color palettes to match your company's design guidelines.
Report and widget templates
Edit your templates by adding variables to save time as you re-use existing reports and widgets.
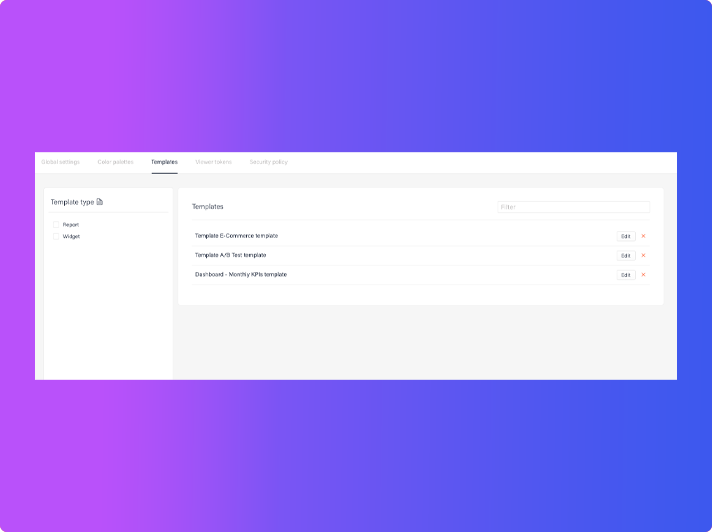
Note: editing your templates is an advanced feature. Feel free to contact us to learn more.
Public url tokens
Create, edit and revoke your public url tokens.
Email domain security policy
Take your account security to the next level by implementing email domain policy and checking conflicts at any time. For instance, set @mycompany.com as the prerequisite to invite any user by email.


COMMENTAIRES