
Google Analytics is a software helping data analysts and marketers understand the audience of their website or app. You can use it to analyze your conversion rate, your sources of traffic and extract insights about your business.Google Analytics is a great data collection and visualization tool.
Google Analytics and Reporting Automation
A great data collection tool because you can copy-paste their javascript-snippet into your code and quickly gather critical data. With a bit more integration work, you can track conversions that match your business goals.
A great visualization tool because you get a comprehensive set of visualizations and metrics at your disposal from scratch without having to do anything.
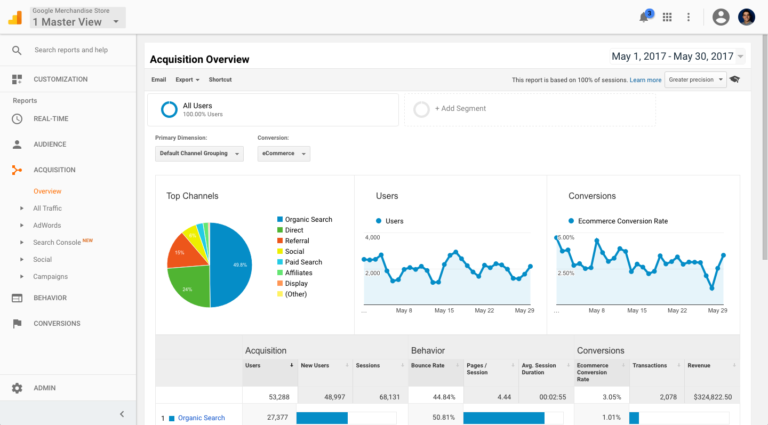
This “all-you-can-eat” approach can be super helpful if you want an analytics overview and a place to find all your website or app data but it can be time consuming when trying to find insights in that sea of metrics on a regular basis.
One way to fix this problem is Reporting Automation.
Reporting Automation is the process of scheduling the delivery of an automatically updated report to a specific person and at a specific time.
This is extremely useful when you don’t want to rely on out-of-the-box reports that Google Analytics provide and want to create customized reports.
Example: You are working for an online travel agency and are looking to have a better understanding of your visitors. What are the most popular destinations? Which destinations are we best at?
To get that information, you will need to understand how your search is working and what people are looking for. Based on that, define what are the relevant pages they should have visited (Product page for example) and then analyze these visitors to get a conversion rate per destination.
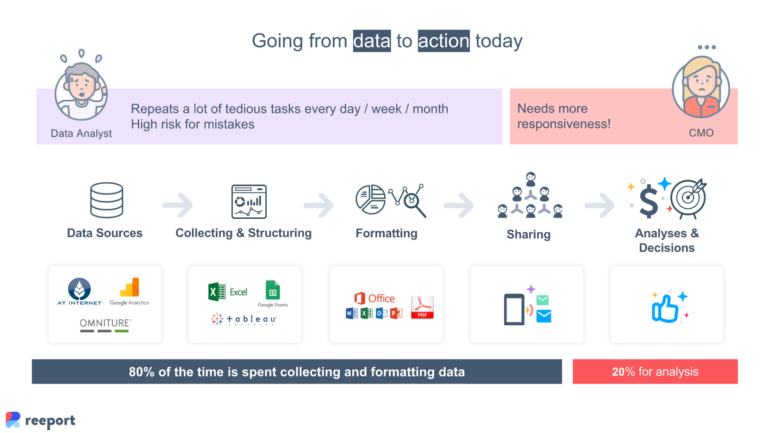
Although awesome, this process used to be really difficult, time consuming and often required advanced technical skills.

You had a choice to make – either spend a lot of time, have strong Google Analytics API knowledge and create customized reporting in Excel OR settle for a “default” reporting.
This is no longer the case.
With the advent of technology, this era is considered over and tools have taken on the responsibility to do the dreadful work and creating real reporting automation. Enabling businesses to accelerate their time-to-insight. Now companies have to level-up and take a push approach to their analysis.
There are several advantages to creating automated reports:
-
No technical knowledge is needed: Data is only as useful as soon as people use it. But to be able to use it, you first need to have access to it. However, most of your team, colleagues or employees don’t have access to your Google Analytics account and don’t want to. So what you want to do is match the recipient’s format preferences – be it email, online via a dashboard, PDF, PPT, XLS, etc. – and customize the content to be as relevant as possible.
-
Create more sophisticated reports: As you plan to automate your reports, you will have to audit your business data needs to make sure your recipients will be happy. This audit will also enable you to have a better understanding of the metrics needed and the scope of your work. With that newly acquired knowledge, you will be able to create more sophisticated reports that match perfectly your business needs.
-
Focus on analysis: Now that your reports are built and automated, you can focus your time on analysis – which is the most impacting task of the whole process. Without it, no decision is made.
Google Analytics Reporting Automation: The Whats, Whys and Hows
You can automate your Google Analytics reporting in a few different ways. Each one tailored to answer specific needs, from standard reports that you can email to a colleague on a regular basis to complex reports filled with multi-source meta-KPIs to that you can edit on the go.
3 different approaches are available to cover this spectrum of possibilities:
Google Analytics Built-in Reporting Features
This is the default reporting solution by Google. There are 4 ways to go about it: Email feature, Embed API, Spreadsheet Add-on & superProxy.
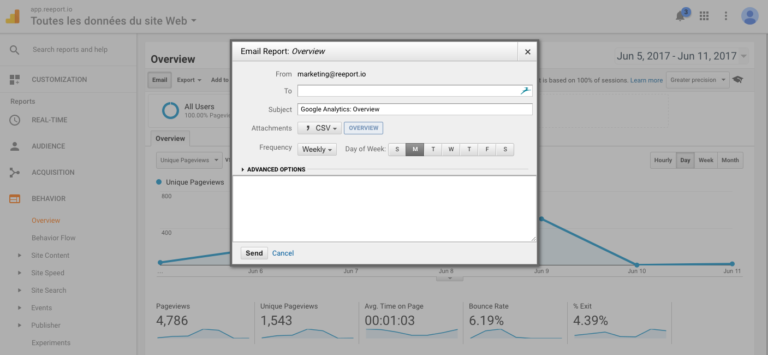
Google Analytics – Email: The Google Analytics Email feature is a simple feature that you’ll find right inside Google Analytics which allows you to easily share over email a standard or custom report. It gives you the ability to send your reports to specific people as well as schedule a recurring delivery.
With the Email feature you get:
- A well-integrated reporting workflow, as you don’t have to use 3rd party tools.
- 5 different formats to match the recipient’s preferences.
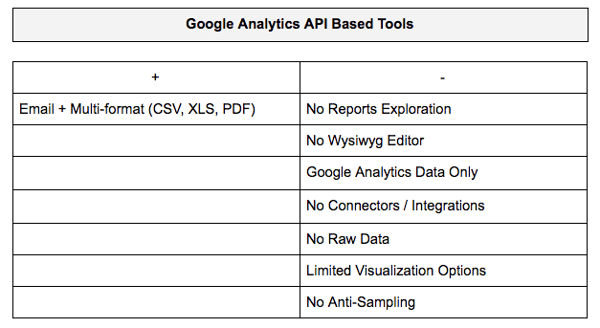
Google Analytics API-Based Tools
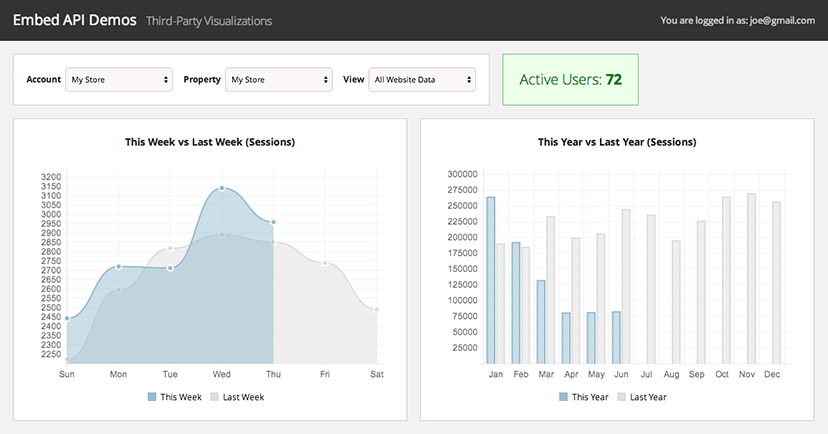
Google Analytics Embed APIs: The Google Analytics Embed API is a JavaScript library that allows you to easily create and embed a dashboard on a 3rd party website in a matter of minutes. It gives you a set of pluggable components that can work together to build complex tools, making it both simple and powerful at the same time.
With the Embed API you get:
- A one-click Google Analytics sign-in button, so you don’t have to handle authorization yourself.
- A built-in view (profile) selector, so you can easily compare data from multiple views at the same time.
- Integration with Google charts to give you the same visualizations you see in Google Analytics.
- Full access to run your own queries, allowing you to use third-party visualization tools like d3.js and chart.js.
- The ability to build and package your own components, so you can easily reuse or share them with others.
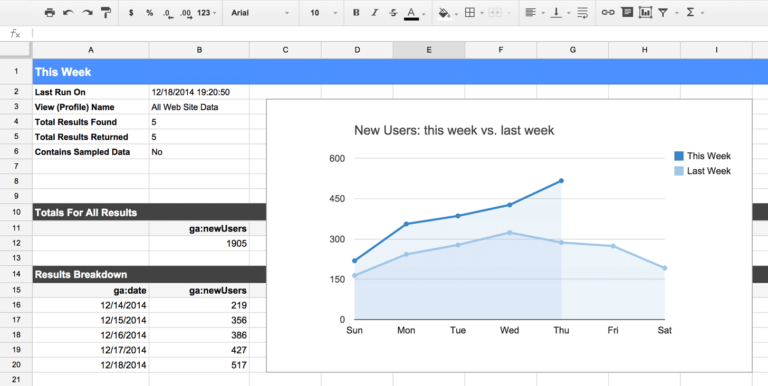
Google Analytics Spreadsheet Add-on: The Google Analytics Spreadsheet add-on makes it easier for Google Analytics users to access, visualize, share, and manipulate their data right from Google Spreadsheets.
The Google Analytics spreadsheet add-on brings you the power of the Google Analytics API combined with the power of Google Spreadsheets’ data manipulation.
With the Spreadsheet Add-on, you can:
- Query and report data from multiple views.
- Compute and display custom calculations.
- Create visualizations and embed those visualizations on third-party websites.
- Schedule your reports to run and update automatically.
- Control who can see your data and visualizations by using Google Spreadsheets’ sharing and privacy features.
- Access to the Multi-Channel Funnels Reporting API
Business Analytics Tools with Google Analytics Integration
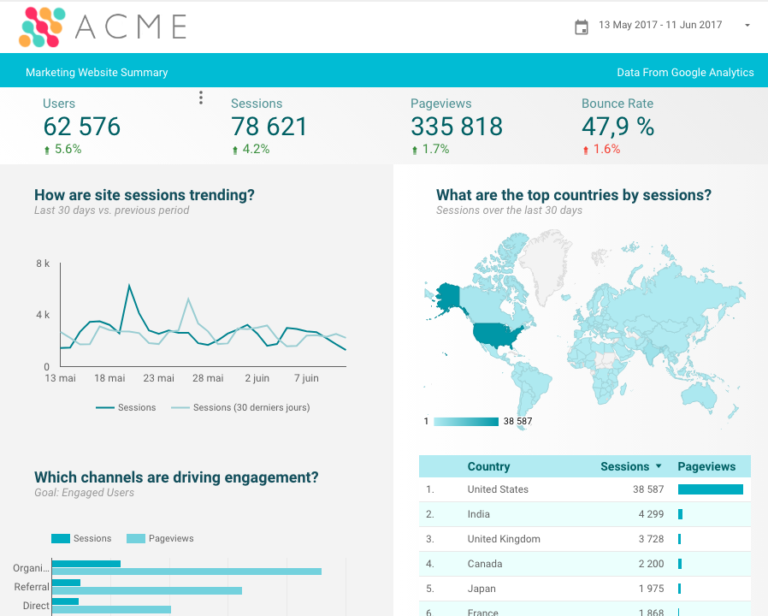
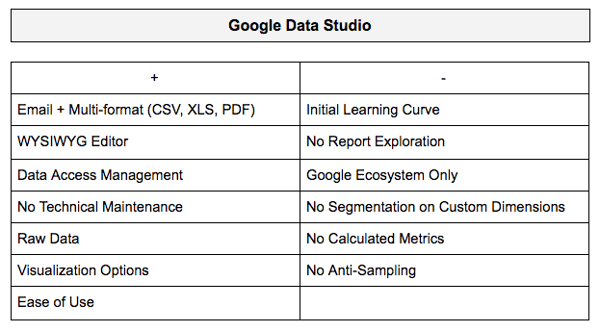
Google Data Studio: “Powerful data visualization software that brings your data to life”
For some of us, the task of turning raw data into reports and dashboards can seem quite intimidating but with Data Studio, you can create shareable charts and graphs with a few clicks.
Data Studio provides:
- A visual editor for easy creation of reports and dashboards.
- A rich library of visualizations.
- Custom design and style controls.
- Reusable templates for fast reports.
- Dynamic and interactive report controls based on time periods, geographies, segments, or any other dimension available in your data.
- Integration (as far as the Google ecosystem) between data, analysis, and reporting.
You can create reports based on most of the Google ecosystem: DoubleClick, Google AdWords, Google Analytics and Google Analytics 360, Google Attribution 360, Google BigQuery, Google Cloud SQL, Google Sheets, YouTube Channel, MySQL & PostgreSQL.
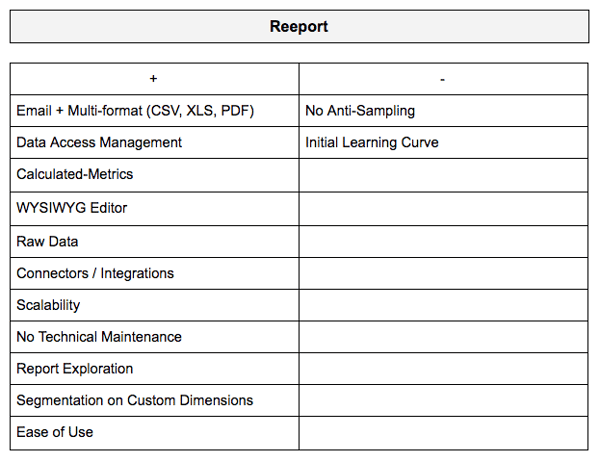
Reeport is a SaaS application layer on top of all your data. Connect all your analytics data, Visualize it and schedule automated Broadcasts.
Connect Reeport to all your data sources and get ready for analysis:
Uncovering business insights starts with capturing the right data. Surfacing the right data is becoming harder and harder as companies are using more and more 3rd party tools, thus scattering the data all around. Connect your marketing data sources to Reeport directly via API and get all your data into one place. No data hosting.
Visualize your data and uncover insights at the speed of thought:
To be able to uncover insights, you need an easy way to understand it. Data visualization enables you to make sense of all your data. Reeport helps you do it on the go on multiple data-sets from multiple data sources (Google Analytics, Adobe Analytics, AT Internet, Facebook, etc.). Add data from other sources and enrich your Google Analytics data.
Broadcast your business insights automatically across your company:
Supplying your employees with relevant data empowers them to take data-driven decisions which is essential to maximize their effectiveness. No more waiting for the data analyst to get all the data into reports and send it.
With Reeport you get:
- API Connectors to Google Analytics and other marketing data sources.
- A WYSIWYG editor to create insightful reports fastly.
- A complete set of tools to organize your data and maximize insights.
- A library of visualizations to create actionable data stories.
- A powerful calculated metrics feature.
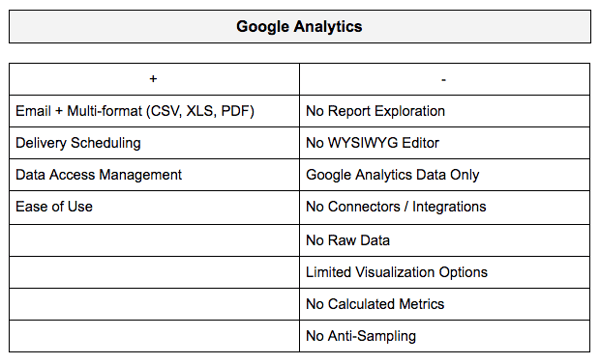
Summary – Pros & Cons
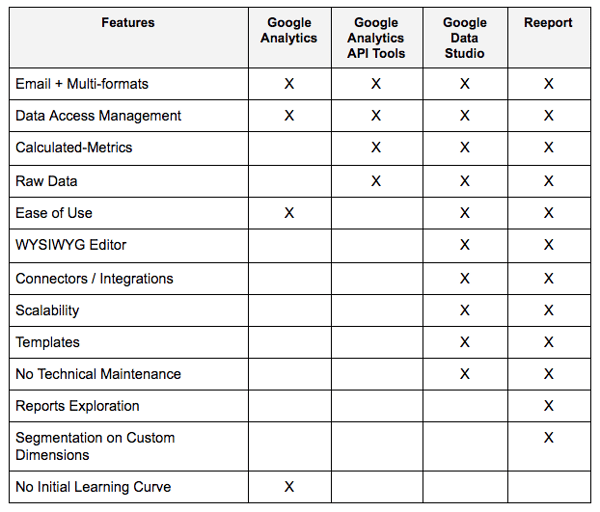
Reporting Automation can help you save hours every week while making sure you send personalized reports. However, not all solutions can solve your problems and it’s important to identify your needs and resources before picking a tool. Google Analytics Automation feature is the simplest version you will find whereas you will need to be more technical to use the google api and/or spreadsheets add-on. One way to get the best of both world is to use a business analytics tool connected to Google Analytics to go deeper into your analysis. You can use Google Data Studio if you are running fully on the Google ecosystem and if you don’t need specific calculated metrics. If otherwise, Reeport is the best way to go.
To learn more :
- Dashboard - Le Traitement Automatique du Langage Naturel (TALN)
- Dashboard - exemples Dashboard marketing pour suivre les performances
- Dashboard Widget - définition, exemples et BI
- Dashboard - les tendances BI qui révolutionneront le dashboard en 2019
- Dashboard - le traitement automatique du langage naturel (TALN) dans les outils de Business Intelligence
- Dash board - définition, exemples et BI

COMMENTAIRES